Refugees have been coming to The Netherlands constantly. How many refugees are entering the Netherlands every month and what is the main origin of these refugees.
Statistics - 2014
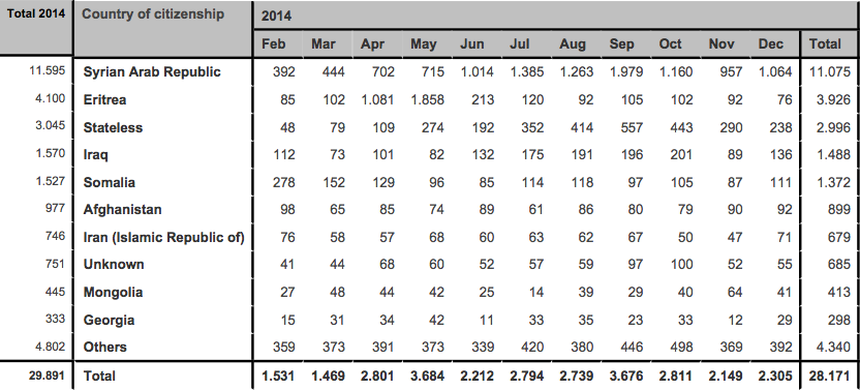
Asylum Statistics of the year 2014 - Source: IND Asylum Trends
The table above is an overview of the amount of asylum requests in The Netherlands monthly in 2014. Unfortunately the statistics of Jan 2014 is missing in this table. The total amount of Refugees that sought asylum in the Netherlands were 29.892. Most of the asylum requests were in May while the least were in March. The table shows us that most of the refugees were from Syria then from Eritrea and the third group didn't have a nationality.
Statistics - 2015
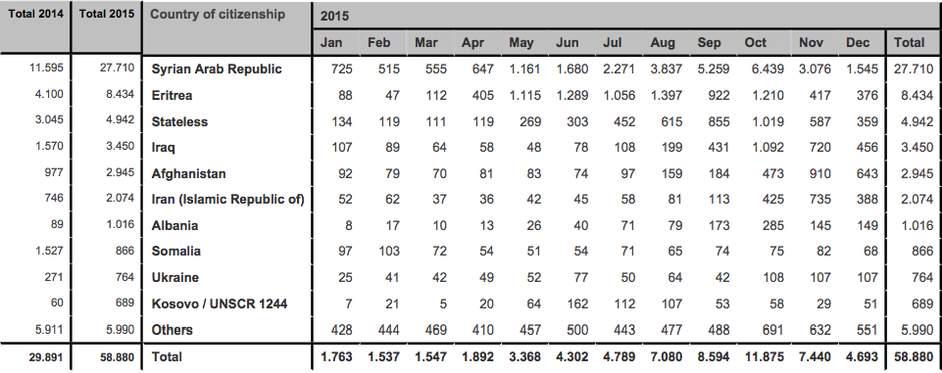
Asylum Statistics of the year 2015 - Source: IND Asylum Trends
Above you can see a very clear and detailed overview of the amount of asylum request in The Netherlands monthly. We notice that in October the amount of refugees entered is very high while in February the amount is the least. The table also shows us that the most number of refugees are from Syria then Eritrea and the third largest group does not have a nationality, this is the exact same as the previous year (2014). If we compare the number of refugees between 2014 and 2015 we see that the amount has almost doubled which is a huge change in the statistics.
|
The graph on the right compares the asylum requests per month of 2014 and 2015. We can see that in general there is a substantial change in asylum requests. In October the difference between the asylum requests of the two years is the most while in March this is clearly the least. The graph shows us that before May the refugees entering The Netherlands for both the years were approximately the same however after May the asylum requests in 2015 increased reasonably while in 2014 they didn't change a lot. |
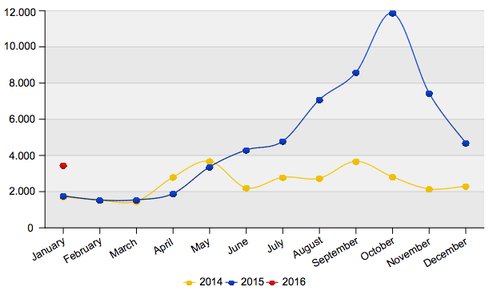
Total Asylum Applications in The Netherlands - Source: IND Asylum Trends
|
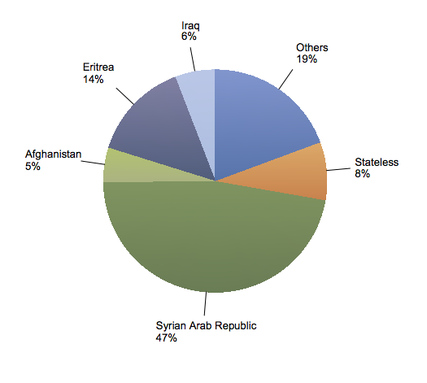
Division of Asylum Applications by Countries in 2015 - Source IND Asylum Trends
|
The pie chart on the left shows the different nationalities that have submitted an asylum application in The Netherlands. The Syrian population makes up almost 50% of the pie chart. This is followed by the Eritrean population and then finally the refugees that don't have a nationality. The pie chart is a very useful way to display this information clearly and easily. |
Statistics - 2016
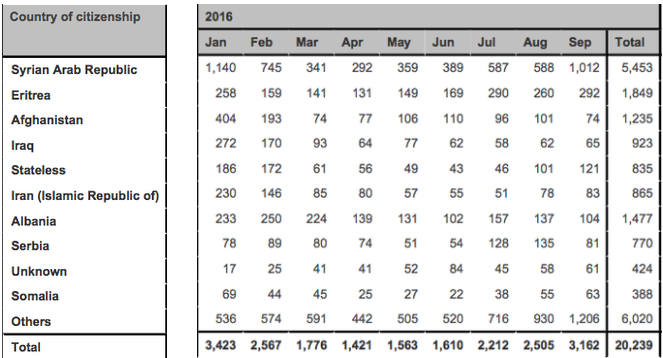
Asylum Statistics of the year 2016 - Source: IND Asylum Trends
The table above shows the amount of asylum requests in The Netherlands from the period January to September. Unlike the other years this year Afghanistan is in the top 3 nationalities that sought asylum. The first one is Syria, then Eritrea and finally it is Afghanistan. Until now the Netherlands has received a total of 20,239 refugees. Out of these refugees most of them came in January while the least came in April.
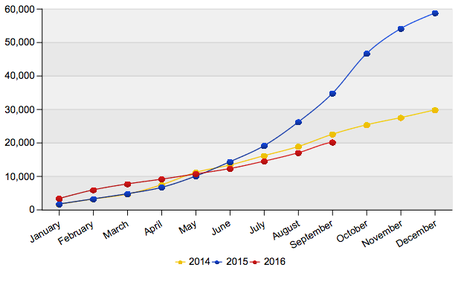
Cumulative development of total asylum applications in The Netherlands - Source: IND Asylum Trends
|
The line graph on the left shows you the total asylum applications in the Netherlands. The graph compares the years 2014, 2015, & 2016. What we can clearly see is that the amount of asylum applications is the lowest in 2016 compared to 2014 and 2015. This was very unexpected by the Dutch government as they were expecting quite high numbers of refugees also in 2016. |
When comparing the statistics of all three years we clearly notice that the asylum applications were the most in 2015, the second most in 2014 and then at last it is 2016. We also noticed that the main nationalities coming to the Netherlands is either Syria or Eritrea. This has remained constant for the past three years and hasn't change at all.
Bibliography
- Ministry of Security and Justice. "Asylum Trends December 2015." (2015): n. pag. Dec. 2015. Web. 29 Nov. 2016.
- Ministry of Security and Justice. "Asylum Trends Jan 2016." (2016): 1-17. Jan. 2016. Web. 29 Nov. 2016.
- Ministry of Security and Justice. "Asylum Trends Feb 2015." (2015): 1-16. IND Business Information Centre (BIC), Feb. 2015. Web. 29 Nov. 2016.
- "De Vluchtelingencrisis in Vijf Grafieken." NOS. NOS, 15 Oct. 2015. Web. 29 Nov. 2016.
